Normalized Difference Vegetation Index (NDVI)
Normalized Difference Vegetation Index means just that. It's an often-used measure of plant growth that may be derived from satellite or aerial photography. The normalized difference vegetation index (NDVI) is a metric that assesses the density and health of vegetation in a certain region.Based on how well plants reflect light in the red and near-infrared (NIR) ranges.
Normalised Difference Vegetation Index = (NIR - Red) / (NIR + Red)
The "NIR" in this formula stands for near-infrared reflectance, whereas the "Red" stands for red reflectance. Calculated NDVI values swing from minus one to plus one. The normalized difference vegetation index (NDVI) map, often called an NDVI image or NDVI raster, is a graphical representation of the NDVI values computed for a region or landscape.
Distinct colors or hues reflect distinct ranges of NDVI readings, revealing shifts in plant density and health. The vegetation index values are often shown as a color gradient on an NDVI map. Green signifies dense and healthy vegetation (high NDVI values), whereas red or brown indicates sparse or stressed vegetation (low NDVI values) on a scale from green to red.
Agriculture, forestry, environmental monitoring, and land management are just a few uses for NDVI maps. They are useful for identifying areas of vegetative stress, such as those impacted by drought or disease, and for understanding the geographical distribution of vegetation and changes in vegetation over time.
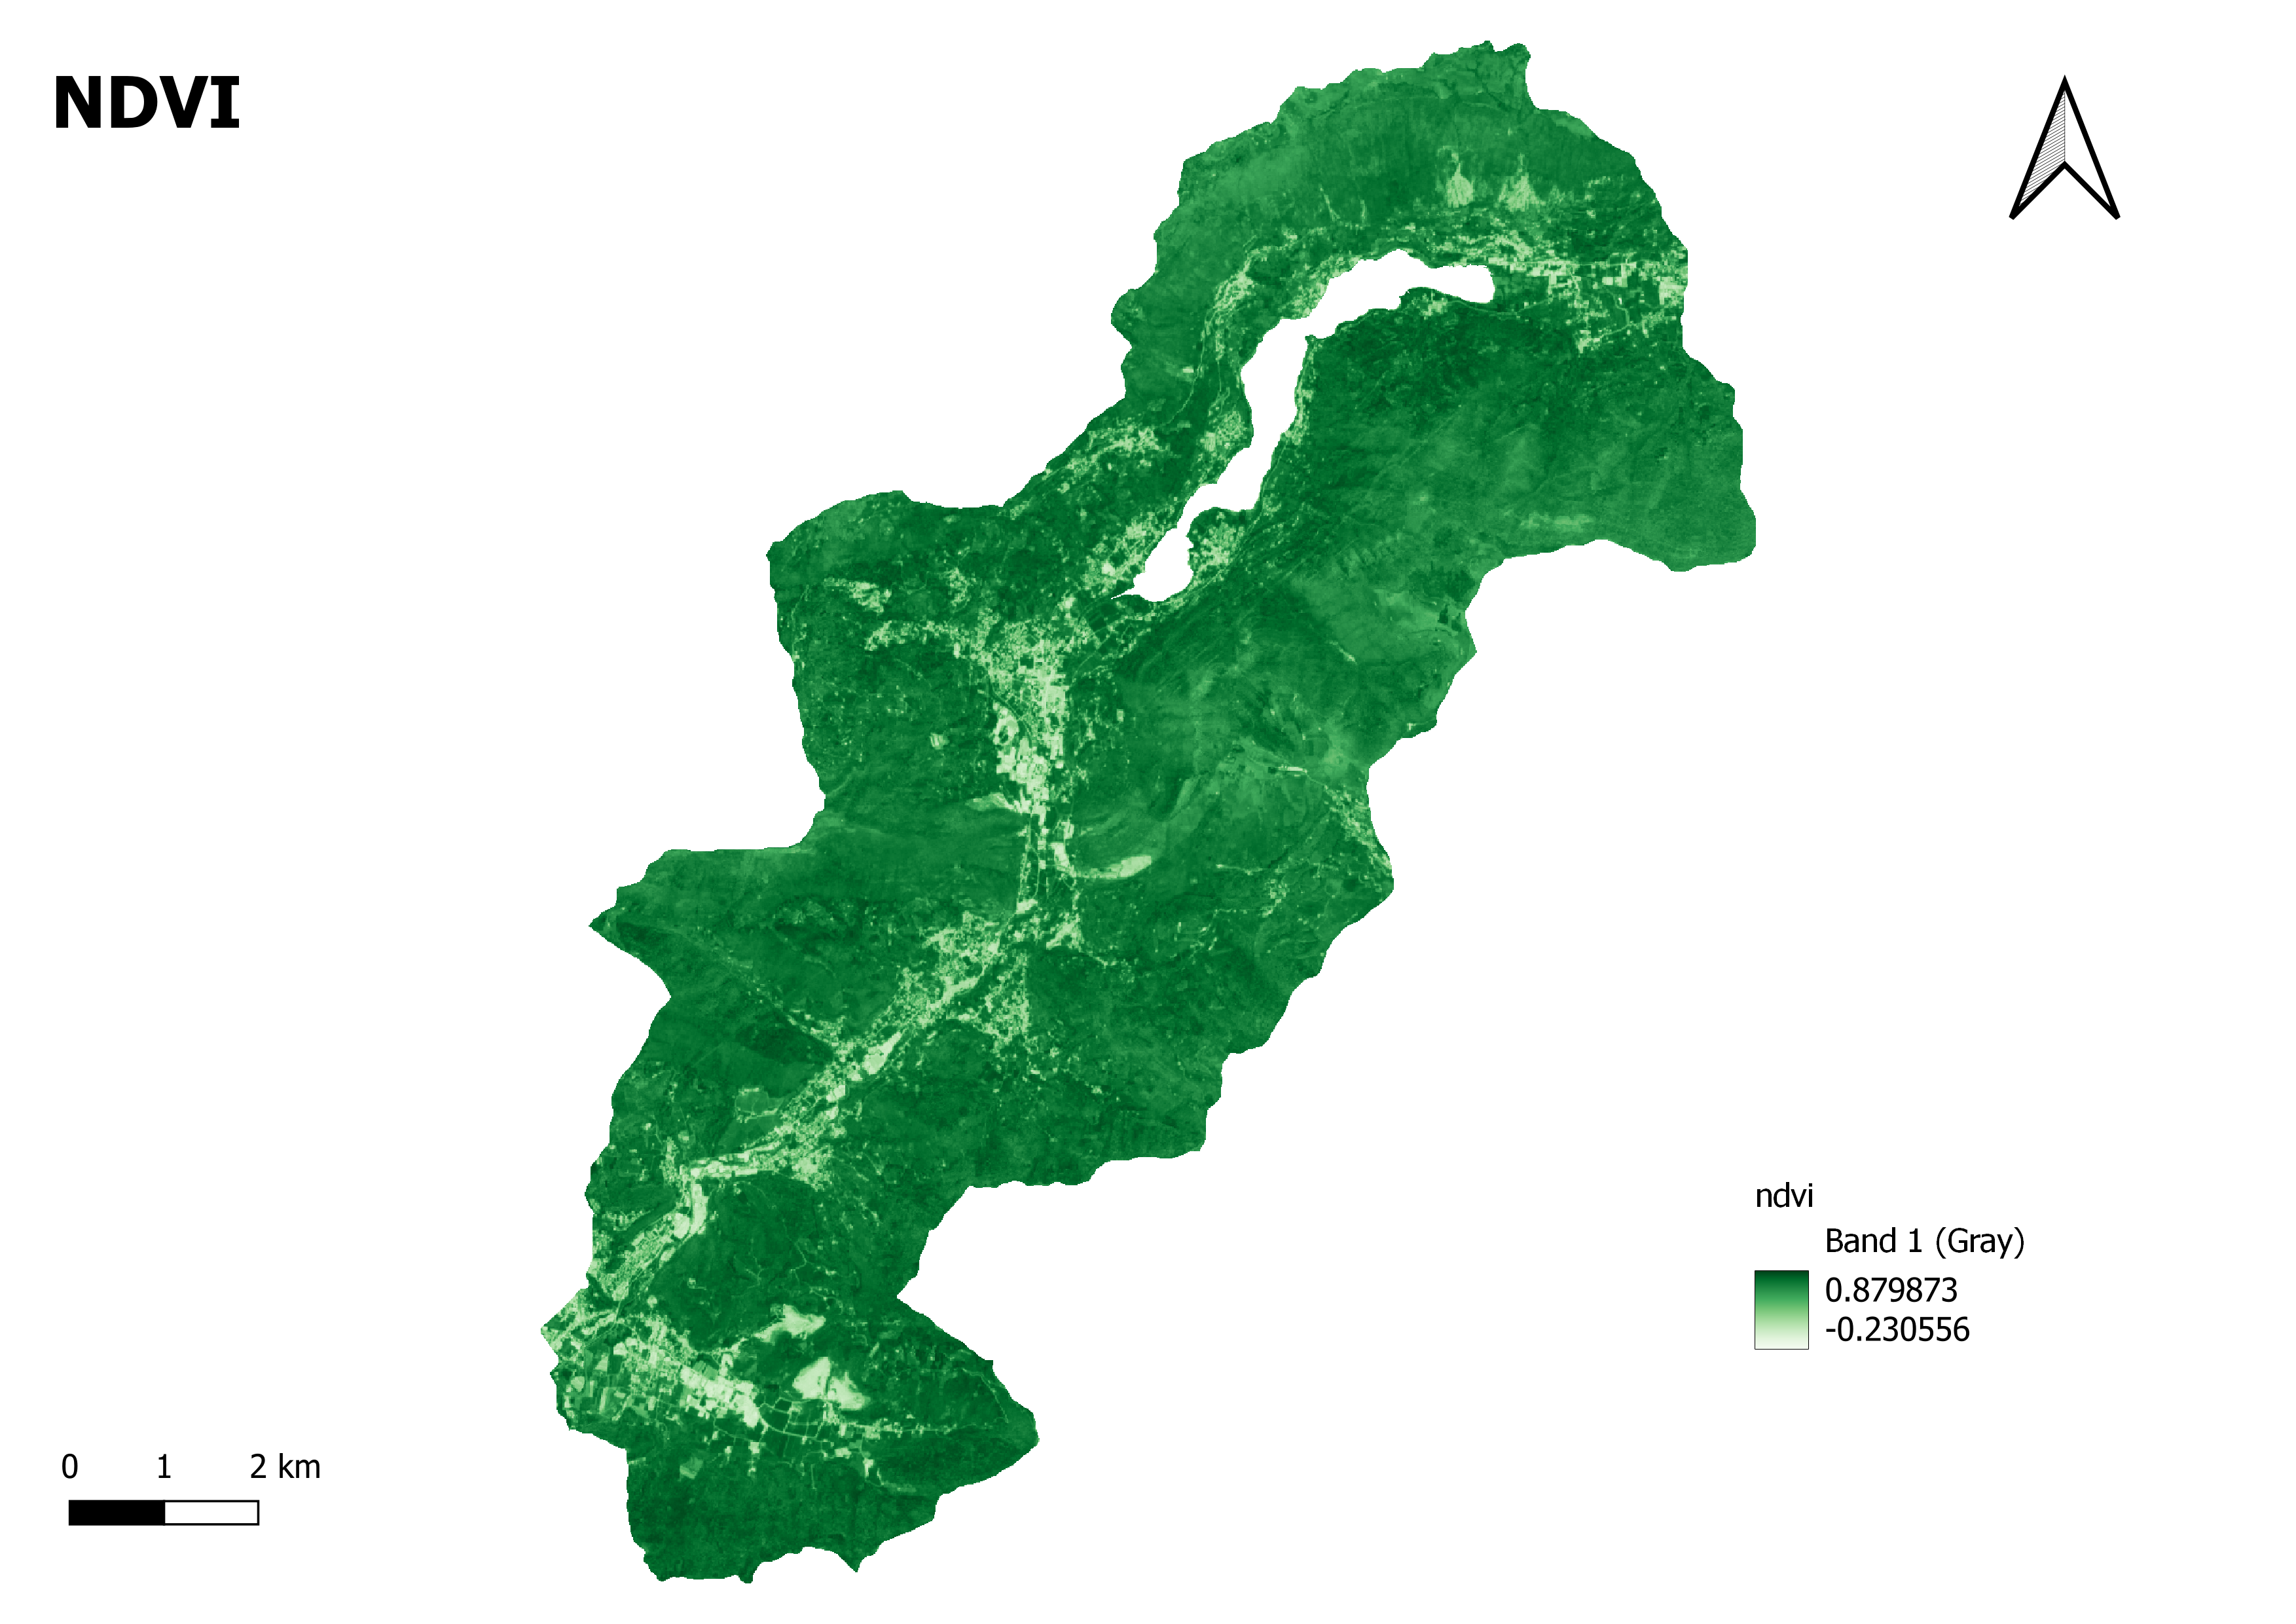
Land cover changes, plant dynamics, and the success of land management may all be evaluated via NDVI maps.The range of NDVI values shown on a map, such as the range we specified of 0.879873 to -0.230556, is representative of the whole spectrum of NDVI readings taken from the area depicted on the map. The density and condition of plants across the terrain may be inferred from this range.